Introduction
Modern digital systems generate an enormous amount of information over time. Every application login, financial transaction, sensor measurement, server request, device event, purchase, delivery update, and system alert can produce a timestamp. When these events are collected in chronological order, they form a temporal record that can reveal how a system behaves.
A single timestamp may appear simple. It might contain a date, a time, and information about a time zone. However, when thousands or millions of timestamps are analyzed together, they become much more valuable. Their relationships can reveal recurring patterns, unexpected changes, delays, missing events, unusual activity, and other forms of temporal anomalies.
This is where artificial intelligence (AI) becomes useful.
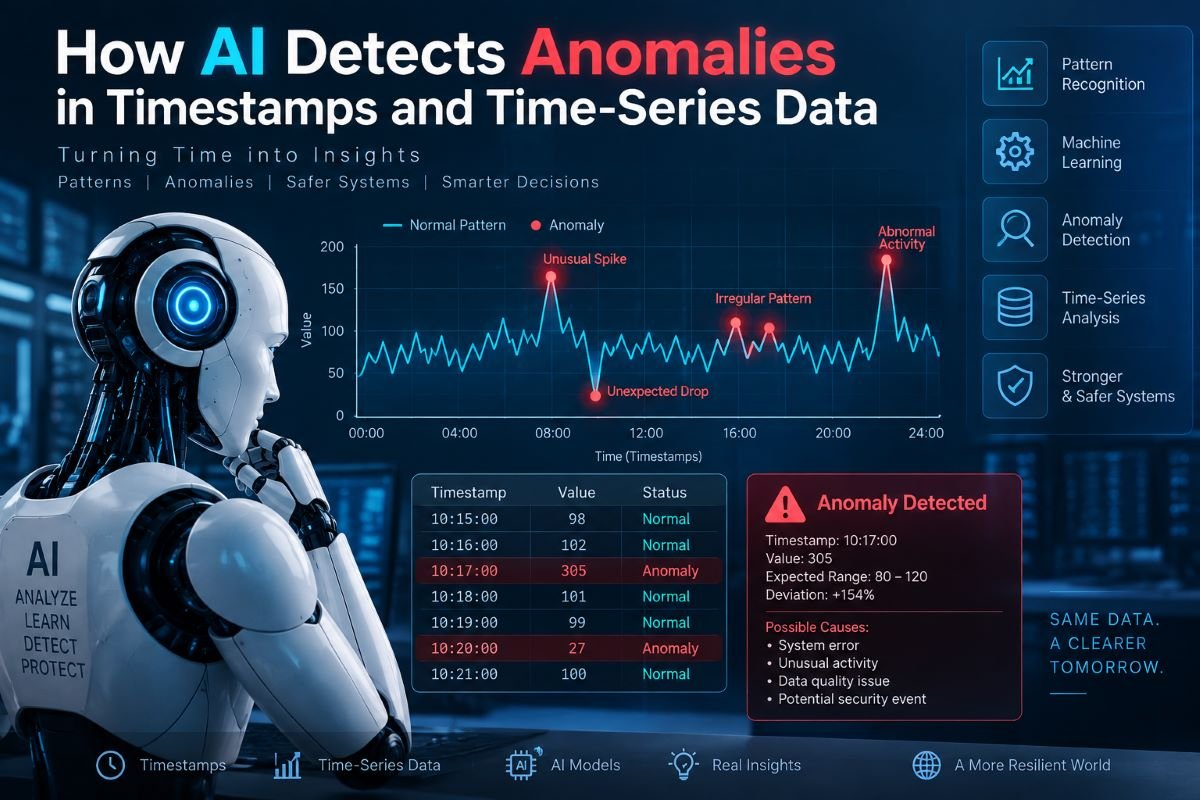
AI-based anomaly detection can examine time-series data and learn what normal behavior looks like. Instead of relying entirely on manually defined rules, machine learning models can identify patterns across time and flag observations that significantly differ from those patterns.
For example, a monitoring system may normally receive measurements at regular intervals. If a sensor suddenly stops reporting, produces measurements at an unusual frequency, or generates values that differ sharply from its historical behavior, an AI system may identify the event as anomalous.
Similarly, an online service may normally experience predictable traffic patterns throughout the day. A sudden change in request frequency, an unusual sequence of events, or activity occurring at an unexpected time may indicate a technical problem, configuration error, fraud, or security incident.
Understanding how AI detects these anomalies requires looking at more than the values themselves. AI must also understand when an event occurred, how events are spaced apart, what sequence they form, and how those patterns change over time.
This article explains the structure of timestamp-based data, how AI models learn temporal patterns, the main techniques used for anomaly detection, common examples, limitations, and why accurate time information is essential for reliable AI analysis.
What Is a Timestamp?
A timestamp is a representation of a specific point in time associated with an event or observation.
A timestamp may include several components, such as:
- date
- time of day
- time-zone information
- UTC offset
- fractional seconds
- other system-specific temporal information
For example, a system might record an event using a representation such as:
YYYY-MM-DD HH:MM:SS
Another system may include a UTC offset:
YYYY-MM-DD HH:MM:SS±HH:MM
The exact representation can vary, but the purpose is the same: to establish when something happened.
Timestamps become particularly important when multiple records are compared.
Consider a sequence such as:
| 08:00 → Event A |
| 08:05 → Event B |
| 08:10 → Event C |
| 08:15 → Event D |
| 08:20 → Event E |
The individual timestamps contain useful information, but their intervals reveal an additional pattern. Events are occurring approximately every five minutes.
If the next event occurs at:
| 09:05 → Event F |
the value itself may not look unusual. However, the gap between the previous events and this event is much larger.
An AI system analyzing temporal behavior may therefore detect an anomaly based not only on the timestamp but also on the time interval between events.
What Is Time-Series Data?
Time-series data is data collected or recorded in relation to time.
A basic time-series record can contain:
| Timestamp | Value |
| 08:00 | 42 |
| 08:05 | 43 |
| 08:10 | 44 |
| 08:15 | 45 |
| 08:20 | 46 |
The timestamp provides the temporal dimension, while the value represents an observation.
Time-series data appears in many environments:
- temperature monitoring
- website traffic
- stock and financial systems
- industrial sensors
- electricity consumption
- application performance monitoring
- network activity
- logistics
- manufacturing
- scientific experiments
- IoT devices
- machine operations
- business analytics
The important characteristic is that the order of observations matters.
In ordinary tabular data, rows may sometimes be treated independently. In time-series data, one observation can depend strongly on what happened before it.
For example, a temperature reading of 35°C may be normal during one period but unusual during another. Likewise, 10,000 website requests may be normal during a busy period but abnormal during a normally quiet period.
AI therefore needs to consider both the value and its temporal context.
What Is an Anomaly?
An anomaly is an observation or pattern that differs significantly from expected behavior.
Anomalies are often classified into several broad categories.
Point Anomalies
A point anomaly occurs when an individual observation is unusual compared with expected behavior.
For example:
| 100 |
| 102 |
| 101 |
| 103 |
| 250 |
| 102 |
| 101 |
The value 250 may be a point anomaly if the surrounding values normally remain near 100.
Contextual Anomalies
A contextual anomaly is unusual only within a particular context.
Suppose a website normally receives high traffic during the daytime and low traffic at night.
A traffic level of 5,000 requests per hour might be normal during the day but unusual at night.
The same numerical value therefore has different meanings depending on its temporal context.
AI models can use information such as:
- hour of day
- day of week
- seasonal behavior
- recent observations
- historical patterns
to determine whether an observation is anomalous.
Collective Anomalies
A collective anomaly occurs when a group or sequence of observations is unusual even though individual observations may appear normal.
For example:
| 10 → 11 → 10 → 12 → 11 → 10 |
may be normal.
But:
| 10 → 11 → 12 → 13 → 14 → 15 → 16 |
could represent an unusual trend if the system normally remains stable.
No single value necessarily looks abnormal. The anomaly becomes visible when the sequence is considered as a whole.
This is one of the reasons AI can be valuable for time-series analysis.

Why Timestamps Matter to AI
AI does not only analyze what happened. In many applications, it also needs to understand when it happened.
Temporal information provides context.
Suppose a financial system records:
| Transaction A — 10:02 |
| Transaction B — 10:04 |
| Transaction C — 10:06 |
| Transaction D — 10:08 |
This sequence suggests a regular pattern.
Now suppose another series contains:
| Transaction A — 10:02 |
| Transaction B — 10:03 |
| Transaction C — 10:03 |
| Transaction D — 10:03 |
| Transaction E — 10:04 |
The unusually concentrated activity may be relevant.
AI can examine:
- event frequency
- time intervals
- event ordering
- repeated sequences
- changes in frequency
- gaps in activity
- bursts of activity
- periodic behavior
- relationships between multiple time-series
Therefore, timestamp information can become an important feature in anomaly detection.
How AI Learns Normal Temporal Behavior
The fundamental idea behind many AI anomaly-detection systems is relatively simple:
learn normal behavior first, then identify behavior that significantly differs from it.
The process often involves several stages.
1. Collect Temporal Data
The system receives historical records containing timestamps and measurements or events.
For example:
| Timestamp | Requests |
| 08:00 | 120 |
| 08:05 | 125 |
| 08:10 | 128 |
| 08:15 | 124 |
2. Clean the Data
Before training a model, the data may need to be cleaned.
Common problems include:
- missing timestamps
- duplicate records
- invalid values
- inconsistent time zones
- incorrect ordering
- irregular sampling
- corrupted measurements
- clock differences between devices
Poor-quality temporal data can cause an AI model to learn incorrect patterns.
3. Transform Time Information
AI systems often convert timestamps into useful features.
For example, a timestamp can be transformed into:
- hour
- minute
- day
- weekday
- month
- elapsed time
- time since previous event
- time since last occurrence
- rolling averages
- rolling variation
A timestamp therefore becomes more than a text value. It becomes structured information that a model can analyze.
4. Learn Temporal Patterns
The AI model examines historical behavior.
It may learn that:
- activity increases during certain periods
- values normally fluctuate within a particular range
- events occur at regular intervals
- certain events usually follow other events
- weekends behave differently from weekdays
- unusual spikes are rare
- measurements change gradually rather than abruptly
These patterns establish an approximate model of normal behavior.
5. Score New Observations
When new data arrives, the AI model compares it with the learned behavior.
The system may produce an anomaly score.
Conceptually:
| Normal behavior → low anomaly score |
| Unusual behavior → high anomaly score |
The exact scoring method depends on the model and application.
Detecting Anomalies in Time Intervals
One of the simplest but most useful temporal features is the interval between events.
Suppose a system normally records an event every 10 minutes:
| 10:00 |
| 10:10 |
| 10:20 |
| 10:30 |
| 10:40 |
The intervals are:
| 10 minutes |
| 10 minutes |
| 10 minutes |
| 10 minutes |
Now consider:
| 10:00 |
| 10:10 |
| 10:20 |
| 10:50 |
| 11:00 |
The intervals become:
| 10 minutes |
| 10 minutes |
| 30 minutes |
| 10 minutes |
The 30-minute gap may indicate:
- device failure
- network interruption
- application downtime
- missing records
- delayed processing
- clock synchronization problems
An AI system can learn the normal distribution of these intervals and flag unusually large or small gaps.
This technique is especially useful when the event value itself is unavailable or unreliable.
Detecting Sudden Changes
Another important task is identifying abrupt changes in a time-series.
Consider:
| 50 |
| 51 |
| 49 |
| 52 |
| 51 |
| 50 |
| 51 |
| 120 |
| 122 |
| 125 |
The system was relatively stable before suddenly moving to a much higher level.
AI can identify such changes by analyzing:
- differences between consecutive values
- moving averages
- variance
- trend changes
- distribution shifts
- historical baselines
A sudden change does not automatically mean something is wrong.
It may represent:
- a legitimate increase in demand
- a planned system change
- a new operating condition
- a seasonal event
Therefore, anomaly detection should usually produce an indication for investigation rather than automatically declaring every change to be an error.
Detecting Missing Events
Missing data is itself a temporal anomaly.
Imagine a sensor that normally reports every minute:
| 12:00 |
| 12:01 |
| 12:02 |
| 12:03 |
| 12:04 |
If the next record is:
| 12:20 |
there is a large unexplained gap.
AI can detect missing observations by learning expected reporting frequency.
This can help identify:
- disconnected sensors
- network failures
- software crashes
- data ingestion problems
- communication delays
- system outages
In some environments, detecting missing events may be more important than detecting unusual numerical values.
Detecting Bursts of Activity
Time-series anomalies can also appear as unusually dense clusters of events.
For example, a system may normally receive:
| 100 events/hour |
| 105 events/hour |
| 98 events/hour |
| 102 events/hour |
Then suddenly:
| 4,000 events/hour |
The individual events may all be valid, but the overall frequency may be abnormal.
AI can detect this type of behavior by examining event counts over different time windows.
Possible applications include:
- cybersecurity
- fraud detection
- API monitoring
- server monitoring
- transaction analysis
- IoT systems
The model can learn the normal event rate and identify significant deviations.
Machine Learning Methods for Temporal Anomaly Detection
Different AI and machine learning techniques can be used depending on the type and complexity of the data.
Statistical Models
Statistical approaches establish expected ranges based on historical observations.
A model might estimate:
- mean
- variance
- probability distributions
- confidence intervals
- expected intervals
An observation far outside the expected distribution may receive a high anomaly score.
Statistical methods can be relatively easy to interpret and can work well when temporal behavior is stable.
However, they may struggle when the data contains complex nonlinear relationships.
Clustering
Clustering methods group similar observations or patterns.
If most temporal behavior belongs to several normal clusters and a new observation does not fit well into any cluster, it may be treated as anomalous.
Clustering can be useful when normal behavior contains multiple operating modes.
For example, a system may have separate patterns for:
- low activity
- normal activity
- high activity
An observation that does not resemble any established pattern may require investigation.
Isolation-Based Methods
Isolation-based algorithms attempt to identify observations that are easier to separate from the rest of the data.
The basic intuition is:
unusual observations tend to be easier to isolate than common observations.
These approaches can be useful for high-dimensional datasets where many features are analyzed together.
For timestamp-based systems, the features might include:
- event frequency
- time interval
- value
- change rate
- hour
- weekday
- historical deviation
Neural Networks and Deep Learning
More complex temporal patterns can be analyzed using neural-network architectures designed to process sequences.
These models can learn relationships between observations across time.
For example, a sequence model might receive:
| X₁ → X₂ → X₃ → X₄ → X₅ |
and learn how earlier observations relate to later observations.
If a new sequence differs substantially from learned patterns, the system may produce a higher anomaly score.
Deep-learning approaches can be useful when:
- datasets are large
- patterns are nonlinear
- multiple variables interact
- long temporal relationships matter
- normal behavior changes over time
However, more complex models generally require greater computational resources and careful training.
Autoencoders for Anomaly Detection
Autoencoders are neural networks that can learn to reconstruct input data.
During training, an autoencoder learns to represent normal patterns and reproduce them.
Suppose the model receives a normal sequence:
| 10, 11, 10, 12, 11 |
It may reconstruct it with relatively low error.
If it receives an unusual sequence:
| 10, 11, 48, 12, 11 |
the reconstruction error may become larger.
The reconstruction error can then be used as an anomaly signal.
The underlying principle is:
| Normal pattern |
| ↓ |
| Low reconstruction error |
| ↓ |
| Likely normal |
| Unusual pattern |
| ↓ |
| High reconstruction error |
| ↓ |
| Potential anomaly |
This approach can be extended to multivariate time-series data containing many measurements simultaneously.
Sequence Models
Some AI models are specifically designed to understand sequential dependencies.
These models can analyze patterns such as:
| Event A → Event B → Event C → Event D |
rather than treating every observation as independent.
This is useful when the order of events matters.
For example, in an application workflow:
| Login → Search → Product View → Checkout → Payment |
may be normal.
A sequence such as:
| Payment → Payment → Payment → Payment |
could be unusual depending on the system.
AI can learn expected event sequences and identify deviations.
Multivariate Time-Series Anomalies
Real-world systems frequently generate multiple time-series simultaneously.
For example, an industrial machine might report:
- temperature
- pressure
- vibration
- rotational speed
- power consumption
Individually, each measurement may appear normal.
However, their relationship may become abnormal.
For example:
| Temperature → normal |
| Pressure → normal |
| Speed → normal |
| Vibration → unusually high |
The combination may indicate a developing mechanical problem.
AI can analyze these variables together and identify relationships that would be difficult to detect by monitoring each metric separately.
This is known as multivariate anomaly detection.
Time Zones and Timestamp Normalization
Timestamp accuracy becomes particularly important when data comes from multiple locations.
Consider a global system receiving events from different regions.
One device may report local time while another reports UTC.
If these timestamps are compared without proper normalization, events can appear to occur in the wrong order.
For AI systems, this can create artificial anomalies.
For example:
| Event A → 09:00 |
| Event B → 08:30 |
may appear to be reversed.
After correctly interpreting the associated time zones or UTC offsets, the actual sequence may be:
| Event A → 09:00 UTC |
| Event B → 09:30 UTC |
The problem was not unusual system behavior. It was incorrect temporal interpretation.
Therefore, reliable anomaly detection depends on reliable timestamp handling.
Clock Synchronization and AI Anomalies
Distributed systems may contain many clocks.
Examples include:
- servers
- computers
- sensors
- mobile devices
- industrial machines
- network equipment
If these clocks are not synchronized, timestamps from different systems may disagree.
This can produce:
- negative time intervals
- impossible event ordering
- duplicate-looking events
- false delays
- false bursts
- incorrect latency calculations
An AI model may interpret these problems as anomalies unless clock synchronization and timestamp quality are considered separately.
This demonstrates an important principle:
Not every anomaly in temporal data represents an anomaly in the underlying system.
Some anomalies originate in the data collection process itself.
AI in Server and Application Monitoring
Modern applications produce extensive logs.
A log record might contain:
| Timestamp |
| Service |
| Request |
| Response |
| Latency |
| Status |
AI can analyze these records to identify unusual behavior.
For example, the model may detect:
- sudden increases in response time
- unusual error frequency
- missing heartbeat events
- abnormal request bursts
- changes in service dependencies
- unusual event sequences
Instead of examining every log manually, operations teams can use anomaly scores to prioritize events that deserve attention.
AI for Cybersecurity
Temporal patterns are also important in cybersecurity.
A security system may observe:
| Login |
| Login |
| Login |
| Login |
| Password Reset |
| Login |
The sequence, frequency, and timing of these events can provide useful context.
AI may detect:
- unusual login times
- repeated authentication attempts
- sudden activity bursts
- unusual geographic or device patterns
- abnormal event sequences
- changes in normal user behavior
Time alone is not proof of malicious activity. However, temporal information can contribute significantly to a broader security model.
AI for Financial and Transaction Data
Financial systems generate time-stamped events continuously.
An AI model may analyze:
- transaction frequency
- transaction intervals
- spending patterns
- account activity
- changes in transaction volume
- sequences of related transactions
For example, a sudden burst of transactions may differ significantly from an account's normal temporal pattern.
The model can flag the behavior for additional review.
In such systems, anomaly detection is generally one component of a larger decision process rather than an automatic conclusion that a transaction is fraudulent.
AI for IoT and Sensor Data
Internet of Things devices frequently generate continuous time-series data.
A sensor may produce:
| Timestamp → Temperature |
| Timestamp → Pressure |
| Timestamp → Vibration |
AI can learn normal operating patterns and identify deviations.
Possible anomalies include:
- sudden spikes
- gradual drift
- missing readings
- irregular reporting intervals
- unusual combinations of measurements
- repeated values
- unexpected oscillations
This makes AI-based temporal anomaly detection useful for predictive maintenance and operational monitoring.
AI for Scientific Time-Series Data
Scientific experiments often depend heavily on accurate temporal information.
Researchers may collect measurements over:
- seconds
- minutes
- hours
- days
- longer observation periods
A time-series may reveal trends that cannot be understood from individual measurements.
AI can help identify:
- unexpected observations
- measurement artifacts
- sudden changes
- missing intervals
- unusual cycles
- deviations from expected experimental behavior
However, scientific applications require particularly careful validation because an unusual observation may represent either an error or a genuine discovery.
An AI model should therefore assist scientific analysis rather than automatically remove unusual observations.
The Importance of Data Quality
AI anomaly detection is only as reliable as the data provided to it.
Several temporal data-quality problems can distort model results.
Missing Data
Missing observations can look like system failures even when the underlying system was operating normally.
Duplicate Data
Repeated records may create artificial bursts of activity.
Incorrect Ordering
Records stored in the wrong chronological order can produce false temporal relationships.
Inconsistent Time Zones
Mixing local times and UTC without proper conversion can shift events.
Clock Drift
A device clock that gradually becomes inaccurate can create increasing timestamp errors.
Irregular Sampling
Some models expect regular intervals. Irregular data may require preprocessing or specialized methods.
These problems should be addressed before interpreting anomaly scores.
False Positives and False Negatives
AI anomaly detection is not perfect.
A false positive occurs when normal behavior is incorrectly flagged as anomalous.
A false negative occurs when an actual anomaly is not detected.
Both can create operational problems.
Too many false positives can lead to alert fatigue. If users receive constant alerts that do not represent meaningful problems, they may eventually ignore important notifications.
Too many false negatives can allow serious problems to remain undetected.
The goal is therefore not simply to maximize the number of detected anomalies. The goal is to identify meaningful deviations while keeping the detection system useful and trustworthy.
Why Context Matters
Anomaly detection works best when the model understands the context surrounding an observation.
Imagine a system with the following traffic pattern:
| Morning → increasing activity |
| Afternoon → high activity |
| Evening → decreasing activity |
| Night → low activity |
A high traffic value during the afternoon may be normal.
The same value during the middle of the night may be unusual.
AI models can incorporate temporal context such as:
- time of day
- day of week
- seasonality
- recent history
- long-term history
- related variables
This allows the model to distinguish between expected variation and genuine anomalies.
Seasonality and Repeating Patterns
Many time-series contain repeating patterns.
For example:
| Daily pattern |
| Weekly pattern |
| Monthly pattern |
| Seasonal pattern |
A model that ignores these patterns may generate unnecessary alerts.
Suppose website traffic regularly increases every weekend.
A simple anomaly detector may interpret the increase as unusual.
A temporal AI model can instead learn that the pattern repeats and therefore belongs to normal behavior.
This is one of the major advantages of analyzing time-series data rather than individual records.
Anomaly Detection Is Not the Same as Prediction
These concepts are related but different.
Prediction asks:
What is likely to happen next?
Anomaly detection asks:
Is what happened significantly different from expected behavior?
A model may predict that a system will produce a value near a particular range.
If the actual observation falls far outside that expected range, it may receive a high anomaly score.
Therefore, prediction can sometimes support anomaly detection, but the two tasks should not be treated as identical.
A Simplified AI Anomaly Detection Pipeline
A practical temporal anomaly-detection system can be represented as:
| Data Sources |
| ↓ |
| Timestamp Collection |
| ↓ |
| Data Cleaning |
| ↓ |
| Time Normalization |
| ↓ |
| Feature Engineering |
| ↓ |
| Temporal Model |
| ↓ |
| Anomaly Scoring |
| ↓ |
| Anomaly Scoring |
| ↓ |
| Alert or Investigation |
Each stage matters.
If timestamps are incorrect, the model may learn incorrect temporal relationships.
If the features are poorly designed, important patterns may be hidden.
If the threshold is too sensitive, too many false positives may appear.
If the threshold is too relaxed, important anomalies may be missed.
Human Review Still Matters
AI can process temporal data at a scale that is difficult for humans to match, but human interpretation remains important.
A high anomaly score means:
the observation differs from the model's understanding of normal behavior.
It does not necessarily mean:
the observation is wrong or harmful.
For example, a previously unseen event may be perfectly legitimate.
Human experts can provide context that a model does not possess, especially when systems undergo:
- planned maintenance
- software releases
- configuration changes
- business events
- infrastructure migrations
- unusual but legitimate activity
The strongest systems therefore combine automated detection with appropriate human investigation.
Improving AI-Based Timestamp Anomaly Detection
Several practices can improve reliability.
Standardize Timestamp Representation
Use consistent temporal representations and clearly defined time zones.
Preserve Original Data
Keep the original timestamp when transforming temporal data so that analysis remains traceable.
Validate Temporal Order
Check whether records occur in a logically consistent sequence.
Monitor Clock Quality
Distributed systems should account for clock synchronization and drift.
Engineer Meaningful Features
Useful features may include:
- elapsed time
- event interval
- rolling statistics
- frequency
- time-of-day
- day-of-week
- sequence position
Account for Seasonality
Recurring patterns should be incorporated into the model.
Use Appropriate Thresholds
Anomaly thresholds should reflect the consequences of missed anomalies and false alerts.
Evaluate Continuously
Model performance should be reviewed as system behavior changes.
The Relationship Between Time, Data, and AI
Timestamp anomaly detection illustrates a broader principle in artificial intelligence:
data is not only a collection of values; it also contains relationships.
Time provides one of the most important relationships.
Consider two identical values:
| Value = 100 |
The value alone tells us little.
But when combined with time:
| 08:00 → 100 |
| 08:05 → 100 |
| 08:10 → 100 |
we can see stability.
Now consider:
| 08:00 → 100 |
| 08:05 → 100 |
| 08:10 → 100 |
| 15:00 → 100 |
The value remains the same, but the temporal structure has changed.
This demonstrates why AI systems analyzing time-series data must consider both value and temporal relationship.
Common Challenges in Temporal AI
Several challenges remain important.
Changing Normal Behavior
A system's normal behavior may evolve over time.
A pattern that was unusual previously may become normal later.
Concept Drift
The statistical properties of data can change.
AI models therefore may need to adapt to new operating conditions.
Long-Term Dependencies
Some anomalies become visible only when long periods are considered.
High-Dimensional Data
Modern systems may generate hundreds or thousands of related measurements.
Interpretability
Complex AI models can produce anomaly scores without providing an intuitive explanation.
For operational systems, explaining why an observation was flagged can be almost as important as detecting it.
What an AI Anomaly Score Really Means
An anomaly score is generally a measure of how different an observation or sequence is from expected behavior.
It should not automatically be interpreted as a probability of failure, fraud, or error unless the specific model has been designed and calibrated to provide that meaning.
For example:
| Score: Low |
| → behavior resembles learned patterns |
| Score: Medium |
| → behavior differs somewhat |
| Score: High |
| → behavior differs substantially |
The exact interpretation depends on the model.
This distinction is important because anomaly detection is usually about deviation, not certainty.
Future Role of AI in Temporal Data Analysis
As connected systems continue to generate more time-stamped information, temporal anomaly detection is likely to remain an important AI application.
Future systems can increasingly combine:
- timestamps
- event sequences
- sensor values
- logs
- user activity
- environmental conditions
- system states
- multiple data sources
Instead of examining one metric independently, AI can build a broader understanding of system behavior.
This can support earlier detection of operational problems, unusual activity, data-quality issues, and changes in complex systems.
However, better AI does not eliminate the need for accurate time information. In fact, as models become more sophisticated, the quality and consistency of temporal data become even more important.
Key Takeaways
AI-based anomaly detection in timestamps and time-series data depends on understanding patterns across time rather than examining individual values in isolation.
The most important principles are:
- Timestamps establish when events occur.
- Time-series data combines observations with temporal context.
- Anomalies can involve individual values, context, or entire sequences.
- Event intervals can reveal missing, delayed, or unusually frequent activity.
- AI models can learn recurring temporal patterns.
- Statistical, machine-learning, and deep-learning techniques can all support anomaly detection.
- Multivariate models can identify unusual relationships between several measurements.
- Time zones, clock synchronization, and timestamp consistency are essential.
- Poor-quality timestamps can create false anomalies.
- An anomaly score indicates unusual behavior, not necessarily an error or malicious event.
- False positives and false negatives must both be considered.
- Human investigation remains important for interpreting unusual behavior.
Frequently Asked Questions
How does AI detect anomalies in timestamps?
AI can analyze timestamp patterns such as event frequency, time intervals, ordering, recurring schedules, and deviations from historical behavior. It can then assign an anomaly score to observations or sequences that differ significantly from learned patterns.
Can AI detect missing timestamps?
Yes. If a system normally produces records at predictable intervals, AI or statistical methods can identify unusually large gaps and flag them for investigation.
Can AI detect unusual time intervals?
Yes. The time between consecutive events can be treated as a feature. Unusually short or long intervals may indicate abnormal behavior, missing data, delays, or other system changes.
Does AI need exact timestamps?
Accurate timestamps are highly valuable, especially when event ordering and precise intervals matter. Incorrect timestamps can create artificial patterns and false anomalies.
Can AI analyze multiple time-series at once?
Yes. Multivariate anomaly-detection systems can analyze several related measurements simultaneously and identify unusual relationships between them.
Is every anomaly an error?
No. An anomaly simply means that the observation differs from expected behavior. It may represent a legitimate event, a data-quality problem, a system failure, or something that requires further investigation.
What is the difference between anomaly detection and prediction?
Prediction estimates what may happen next, while anomaly detection evaluates whether observed behavior differs significantly from expected behavior. Prediction can sometimes be used as part of an anomaly-detection system.
Why are time zones important for anomaly detection?
Events from different locations must be interpreted consistently. Mixing local times and UTC without proper conversion can change event ordering and create false temporal anomalies.
Can AI detect anomalies in server logs?
Yes. AI can analyze timestamped server logs to identify unusual request rates, error patterns, latency changes, missing events, and abnormal sequences.
Can AI detect anomalies in sensor data?
Yes. AI can analyze sensor values, reporting intervals, trends, and relationships between multiple sensors to identify unusual operating behavior.
Does anomaly detection require deep learning?
No. Statistical techniques and traditional machine-learning methods can also detect many types of anomalies. Deep learning becomes more useful when temporal relationships are complex or datasets are large and multidimensional.
How reliable is AI anomaly detection?
Reliability depends on data quality, model selection, training data, temporal patterns, threshold settings, and the changing behavior of the system. AI should generally be treated as a detection and prioritization mechanism rather than an infallible decision-maker.
Final Perspective
Timestamps may look like simple labels attached to records, but in a time-series they become a fundamental source of information about system behavior.
The difference between one event and the next, the frequency of activity, the order of events, recurring patterns, missing observations, and relationships between multiple measurements can all reveal information that is invisible when data is viewed one row at a time.
AI provides a way to analyze these temporal relationships at scale.
By learning normal patterns and identifying significant deviations, AI systems can help detect unusual activity across applications, networks, financial systems, industrial equipment, scientific datasets, and connected devices.
The quality of this analysis ultimately depends on a strong foundation: accurate timestamps, consistent temporal representation, reliable data, appropriate models, and meaningful human interpretation.
When these elements work together, time-series data becomes more than a historical record. It becomes a source of insight that allows AI to recognize when the behavior of a system has changed—and to help people understand where further attention may be needed.
Comments
No comments yet.